The labour market, also called the job market, is the market for the supply of skills and time from employees and demand from businesses to hire those people. The unemployment rate and productivity levels are two important macroeconomic variables.
Some terminology.
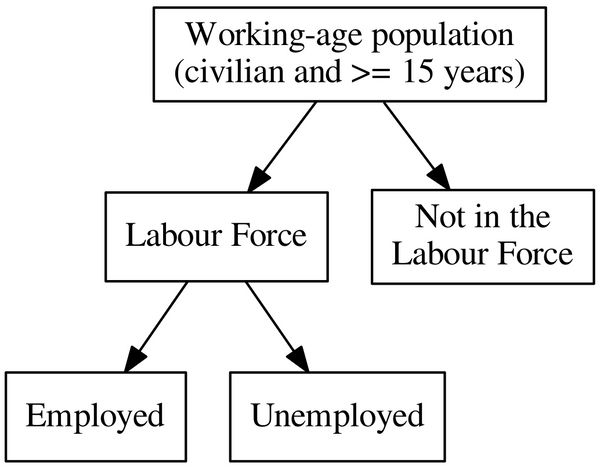
- Working-age population: The population consisting of people who are 15 years and older and not part serving in the military.
- Labour force: Members of the working-age population are either a member of the labour force or not. People may not be in the labour force for a number of reasons: eg. disabilities, and even people who are depressed about not finding a job and have given up. A member of the labour force may be employed or unemployed. Note: the workforce, on the other hand, is the set of people who are actively working, excluding the unemployed people.
- Employed: You are considered employed if you work ≥1 hour per week and earn money for doing so. The exception is that if you’re working for a family business, then that ≥1 hour of work need not be paid.
- Full-time employment: If you work ≥35 hours per week.
- Part-time employment: If you work <35 hours but ≥1 hour per week.
- Unemployed: If you are in the labour force and are not employed and are actively seeking employment, you are formally unemployed and will contribute to the unemployment rate.
- Underemployment: underemployment is a lack of utilisation of your labour. There are two types:
- Time-related underemployment: when you are willing to work for more hours than you currently are offered to work for.
- Skill-related underemployment: when you are working in a job that does not utilise much of your skillset.
- Unemployment rate: the percentage of the labour force that are formally unemployed: .
- Participation rate: the percentage of the working-age population that is a part of the labour force: .
Types of Unemployment
Unemployment is categorised into 3 groups: frictional, structural and cyclical.
-
Frictional — temporary unemployment as a result of transitioning between different jobs or from full-time university.
Change in level of unemployment is given by: , where:
- is the job separation rate
- is the number of employed people
- is the job finding rate
- is the number of unemployed people.
The long-run frictional unemployment is given by: , derived by combining with .
-
Structural — unemployment as a result of fundamental changes to an economy. For example, automation technology might radically change certain industries, causing many people to be made redundant. Structural unemployment involves unemployment arising from insufficient worker skill and job locations being too physically far away.
- Policies that address structural unemployment involve re-training programs for assisting the transition of workers to different industries.
-
Cyclical — temporary unemployment as a result of changes over the business cycle. The cyclical unemployment rate is strongly correlated with recessions.
- Cyclical unemployment can become classified as structural unemployment when the skills of a cyclically unemployed person go out of demand after the business cycle downturn.
- The natural rate of unemployment, given by: , represents the unemployment rate that’s independent of fluctuations in real GDP.
- The cyclical unemployment rate is the difference between total unemployment and natural unemployment , which is: .
Output Gap
The utilisation rate is the rate at which businesses actually utilise their factors of production, primarily labour and capital. Businesses are assumed to have granular control over whether they have a high or low utilisation rate. There is a normal utilisation rate where labour and capital are neither overutilised or underutilised that is considered economically sustainable in the long-term. If all businesses operate at such a utilisation rate, then we achieve the value of the potential real GDP, , or also known as the potential output. It’s hard to measure/estimate potential GDP.
The output gap is the difference between the real GDP and the real potential GDP : , or expressed as a percentage, .
- When the output gap is negative, we call it a contractionary gap. Likewise, we call it an expansionary gap when the output gap is positive.
- Persistent contractionary gaps imply an underutilisation of labour & capital, meaning that we’re not producing as much as we could.
- Persistent expansionary gaps imply an overutilisation of labour & capital. It typically drives inflation to higher rates since prices of goods and services increase in response to higher demand.
The output gap serves as a useful indicator that informs fiscal and monetary policies.
Okun’s Law
Okun’s law is an empirical result that states how a country’s cyclical unemployment rate changes when the output gap changes.
This relationship states that the output gap is directly proportional to the negative of the cyclical unemployment rate. In Australia, the coefficient is estimated to be somewhere around 2, which means that with a 1% rise in cyclical unemployment rate we’ll expect a 2% drop in output gap. We determine empirically through statistics.
Note: a negative cyclical unemployment rate implies that workers who would be frictionally or structurally unemployed have been temporarily pulled into jobs.
Labour Supply & Demand
The labour market can be modelled with the following supply and demand curves:
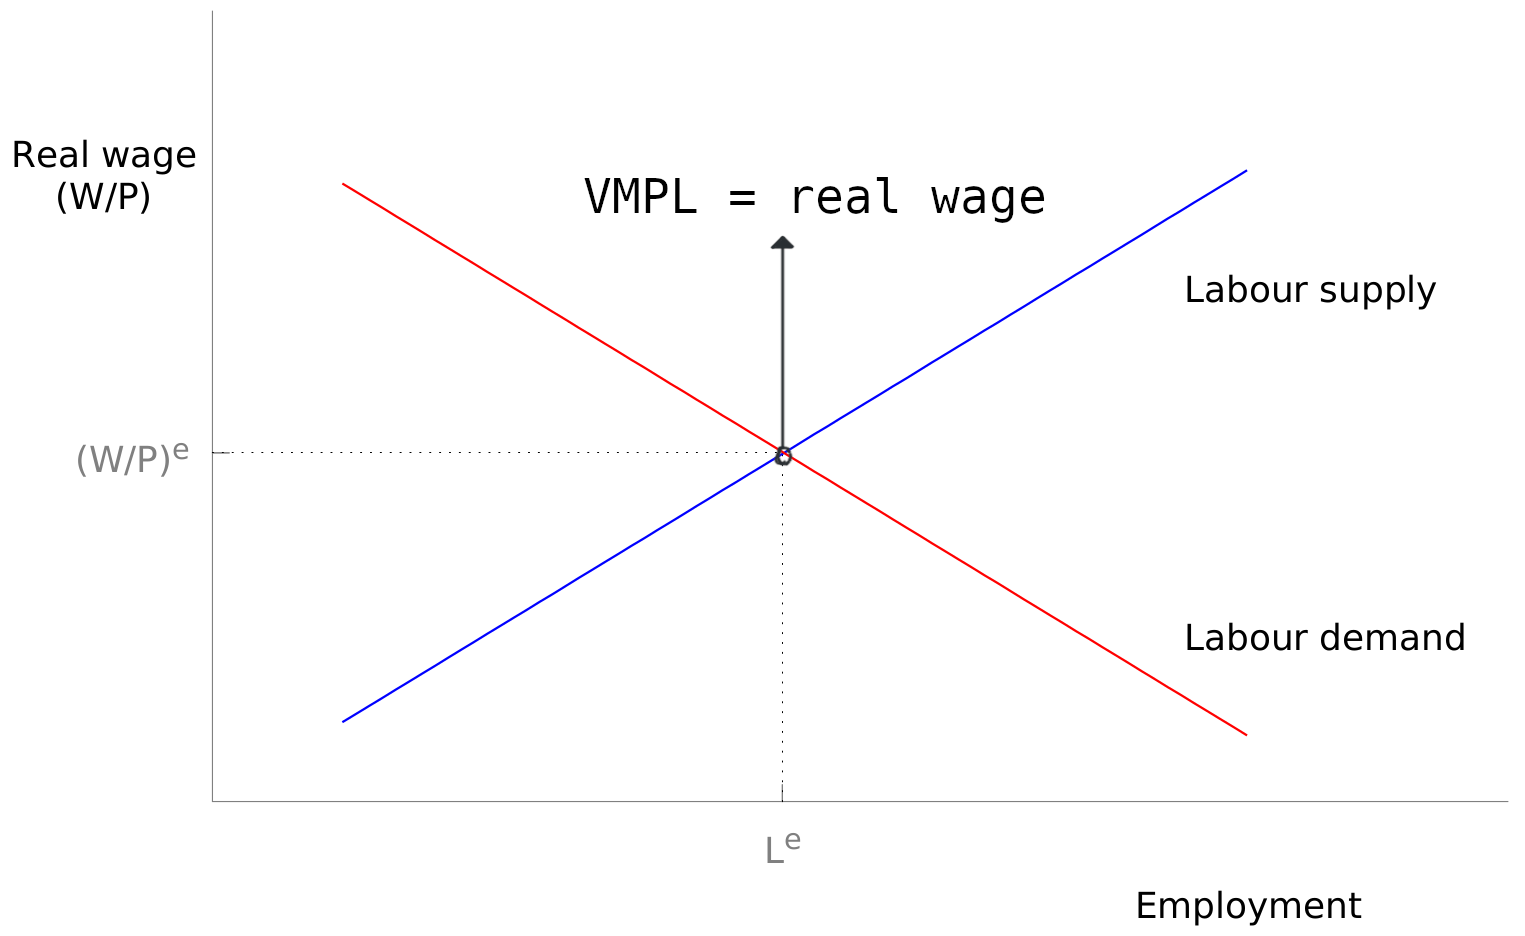
- Marginal product of labour, — the additional output produced when you supply an extra 1 unit of labour (with all other factors of production held constant).
- Value of marginal product of labour, — the monetary value of the additional output produced for each extra unit of labour, ie. , where is the price per unit of output. This represents the labour demand curve.
- Improvements to worker productivity (eg. more capital goods or better technology) will shift the labour demand curve to the right.
- Diminishing marginal product. The ability of each additional worker to help us diminishes. Each new worker produces less than the previous. It’s a valid assumption when you’re holding capital fixed.
- The optimal amount for a firm is when , ie. when gained for an additional work is greater than or equal to the cost of hiring that extra worker.
- Real wage, — the nominal wage divided by some measure of the price of goods & services (eg. CPI).
Observations
-
Shifts in the aggregate labour supply curve can happen due to immigration, birth rate changes, retirement age changes, and any number of other things that influence the general willingness for the population to participate in the labour market.
-
At equilibrium, everyone who is willing to work for the market real wage will be employed.
-
Factors such as minimum wage laws, labour unions, taxes keep us away from market equilibrium real wage.
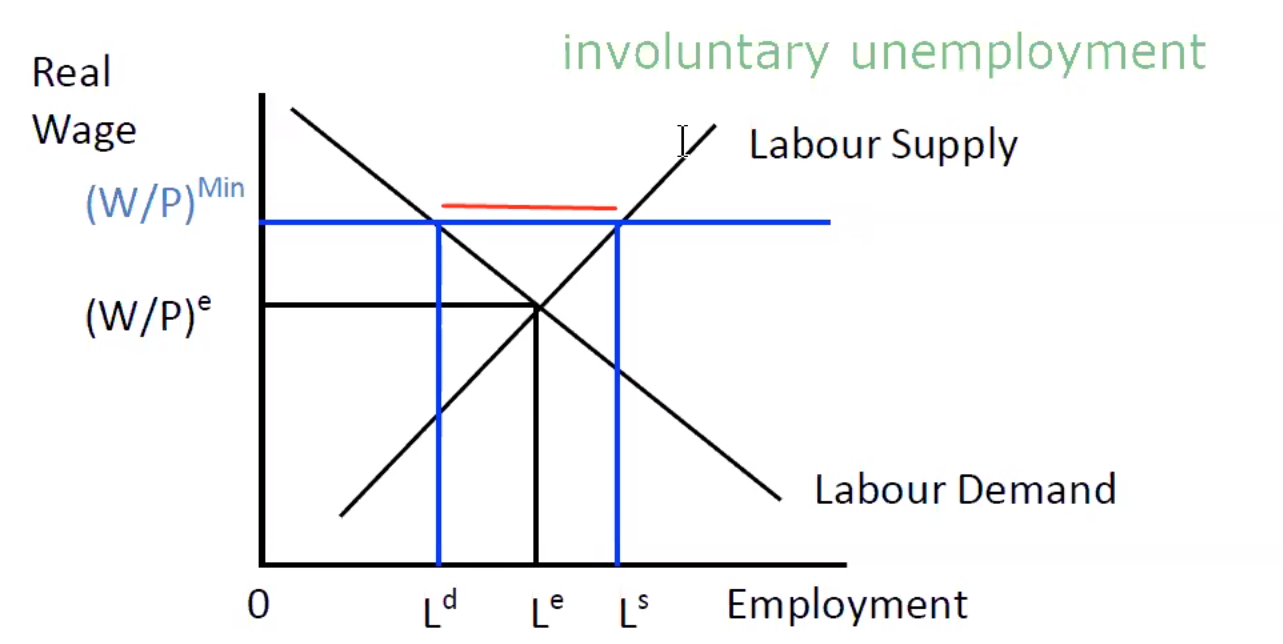 Here, is the number of people who would be willing to work but cannot find employment.
 -
A higher minimum wage will increase unemployment rates, theoretically.
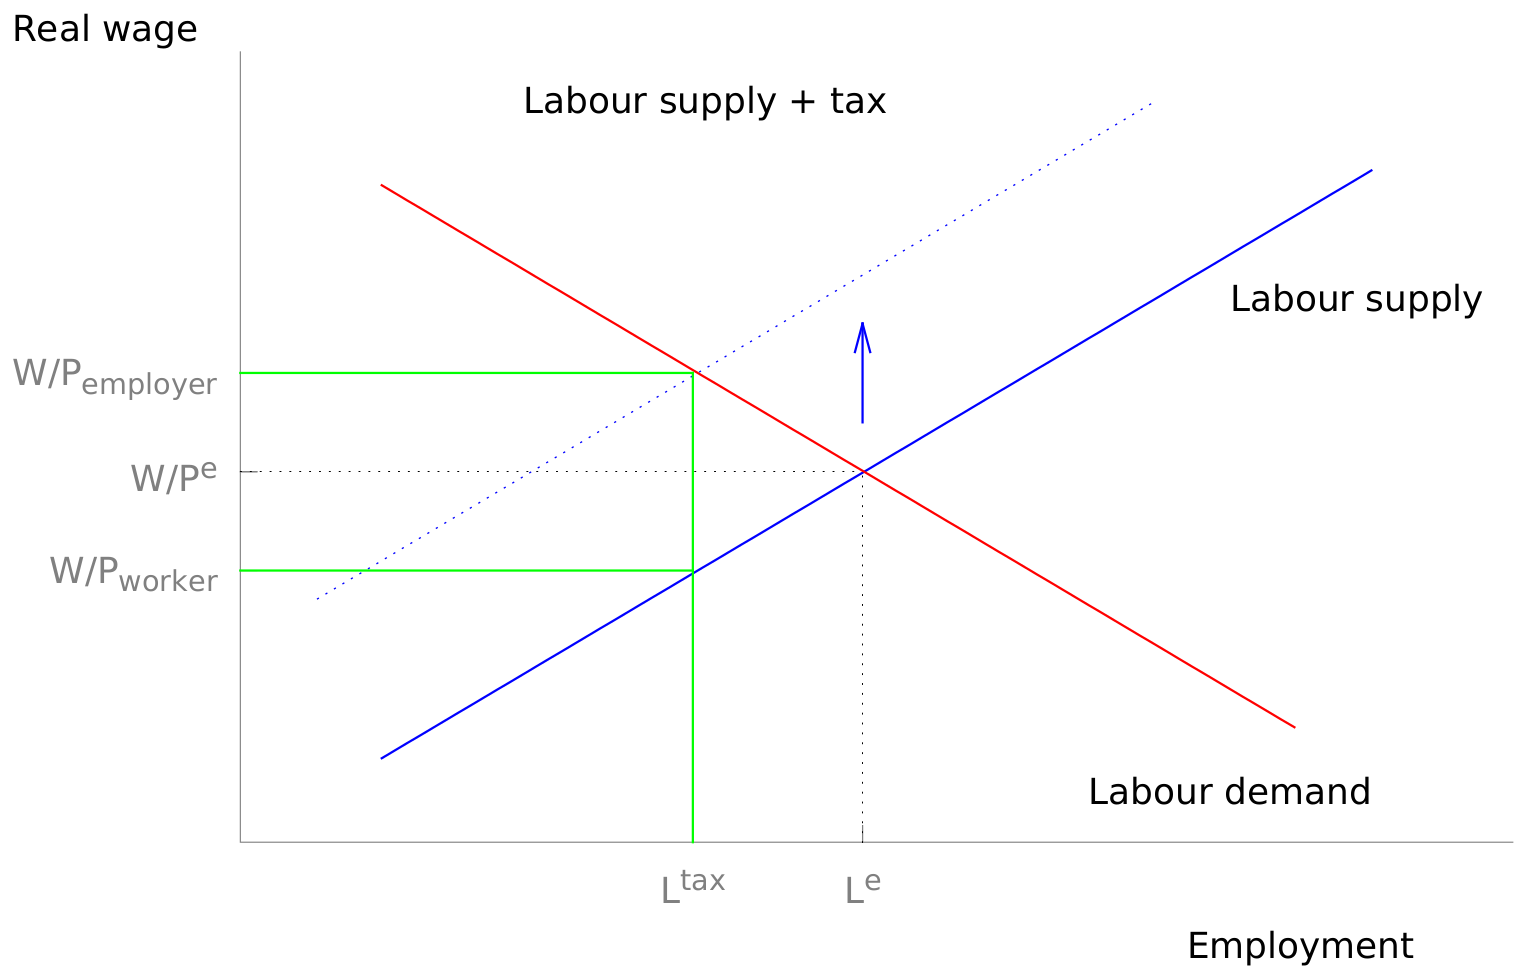
Adding taxes on labour will pull the labour supply curve left since fewer people will be willing to work for a lower net wage.