Prometheus

Prometheus is an open-source real-time monitoring and alerting tool. It’s a popular choice for monitoring Kubernetes clusters, Linux servers, Raspberry Pis, etc. It’s commonly combined with Grafana to make a nice dashboard UI available for us to quickly understand a software system’s metrics.
Popular programming languages have a Prometheus client library that lets you track and expose metrics.
# Usage
# Installing Prometheus Server
| |
Downloading a precompiled binary is the
recommended installation method. Alternatively, you could build directly from source or pull the Docker image and run the Prometheus server in a container with: docker run --name prometheus -d -p 127.0.0.1:9090:9090 prom/prometheus.
# Installing Node Exporter
A node in this context is basically just a virtual machine. The node_exporter binary, maintained officially by Prometheus, is something you can run on a machine whose resources such as memory, disk, CPU you want to make available for a prometheus server to scrape.
| |
# Configuration
In the directory containing the Prometheus binary, set the configuration in the file prometheus.yml. If running a Docker container, use a
bind mount to make the container use your own configuration file.
To get the prometheus server to pull from the node exporter on the same machine, set:
| |
- Scrape interval
- Retention time — the time that metric datapoints stick around before being discarded (to save space).
# Architecture
 (
(
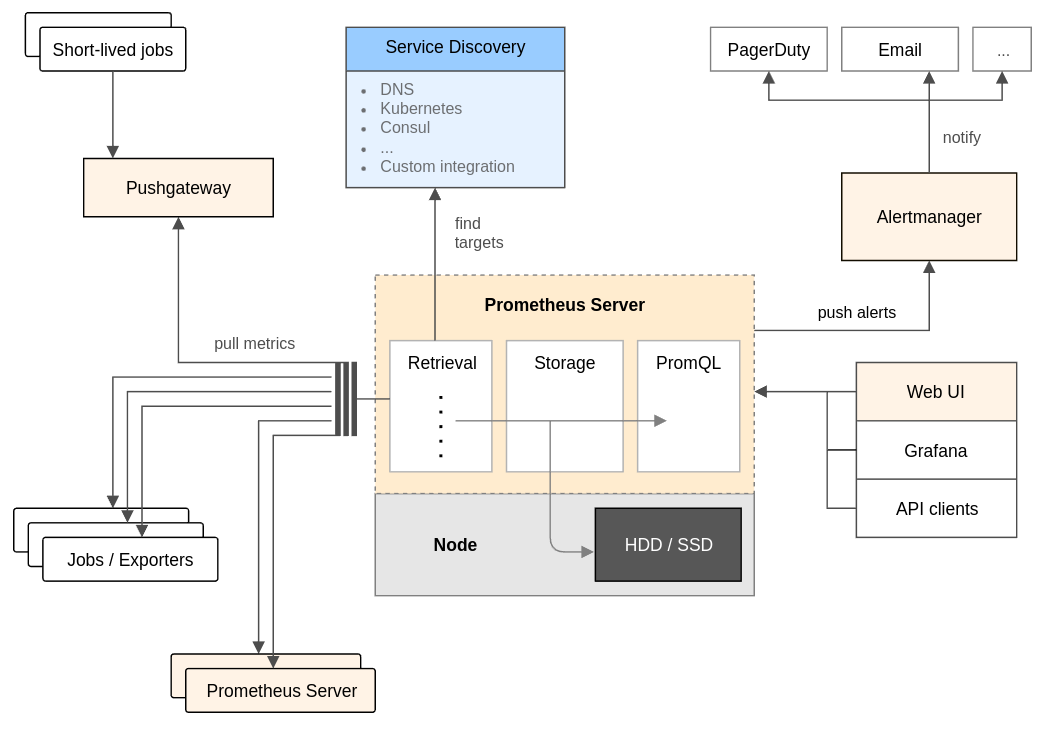
In the above diagram, a machine running a prometheus server does the following:
- Finds the targets it’s meant to pull metrics from.
- Pulls metrics from exporters and possibly other prometheus servers.
- Prometheus uses an HTTP pull model where a Prometheus server sends an HTTP request to a dedicated endpoint exposed by target services to pull metrics from them. This usually results in light network traffic than the alternative, which is to get targets to actively push out data to a prometheus server.
- Makes the metrics available for a client (such as Grafana) to consume via PromQL.
- Pushes alerts to you based on thresholds/conditions you set, using AlertManager.
A target is a service that exposes metrics in a format Prometheus knows how to work with. A Prometheus server pulls (also called ‘scrapes’) data from targets. Targets you might be interested in monitoring include:
- Linux VM running in the cloud.
- Kubernetes cluster.
- Your Raspberry Pi.
- … and so on.
An exporter is what lets you map metrics collected from a system into Prometheus data. It also starts a web server exposing the path /metrics that can be scraped.
- There are 100+ exporters ( official docs).
# PromQL
Prometheus has its own custom database for storing real-time metrics. PromQL is a language for querying metrics from that database, useful for extracting insights that can be displayed on a frontend like Grafana for developers to see.